Demo-Graphics has generally focused on the demographics of comic fans but occasionally we have also reported on other fandoms and communities. In August 2025, we kicked off a new regular look at those interested in tabletop games. That includes board games, roleplaying games, and card games. Why? The question still remains… who are the fans of tabletop games?
What is Demo-Graphics?
Each month I dive into data from Facebook looking at the various demographics it can tell us about comic, and now tabletop game, fans. This isn’t hard numbers, purchasers, or “Wednesday warriors,” but best used to show trends in the industry and the potential of the market out there.
How does it work?
We use key terms, “likes”, that users have indicated and have come up with our own set to measure each month. There’s over 50 terms used (and no I won’t release them). We stick to specific terms for the industry such as “board games” and “collectible card games” as well as publishers and leave out broad terms.
Other things to know…
This data is important in that it shows who the potential audience could be. These are not purchasers, these are people who have shown an affinity for tabletop games, are potential purchasers, and those with a clear interest.
Also, with this being online/technology, due to laws and restrictions, those under the age of 13 are underrepresented.
The data that is presented as a wide range. I’ve taken the average of the range. So, if it’s presented as somewhere between 500 and 1,000 people, the number would be 750.
So, let’s kick off the first entry with the big question…
Facebook “Tabletop Gamer” Population: Around 605.6 million worldwide
In the United States 27.78% of individuals on Facebook indicate they’re also interested in tabletop games. Worldwide, that number decreases to 17.67%, 605.6 million individuals out of the 3.428 billion on Facebook. In the future, we may see how easy it is to see how those numbers break down per country.
Gender
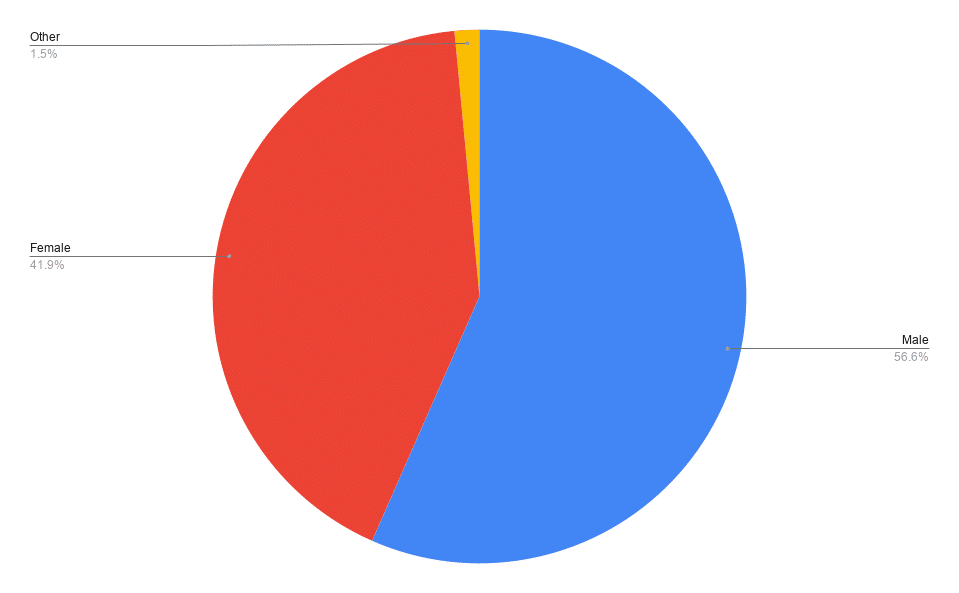
Men are a majority, far more so than in the United States. While in the US, the gender difference is a few percentage points, worldwide it’s almost 15 percentage points. Men account for 56.59% of the population with women making up 41.91% and those not reported as either are 1.5%.
Age
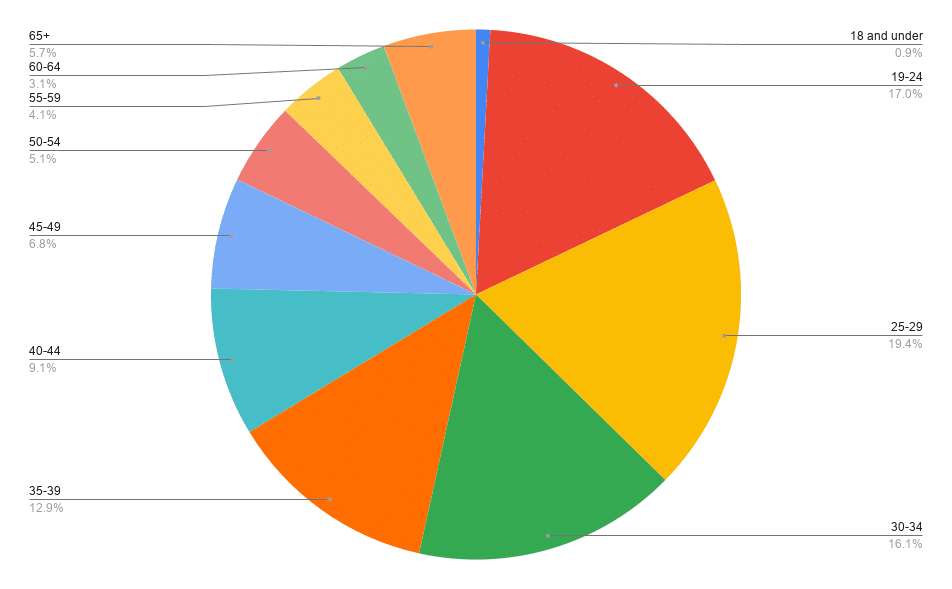
While similar in some ways to the United States data, those 19 to 34 are a far greater percent of the worldwide population.
Relationship Status
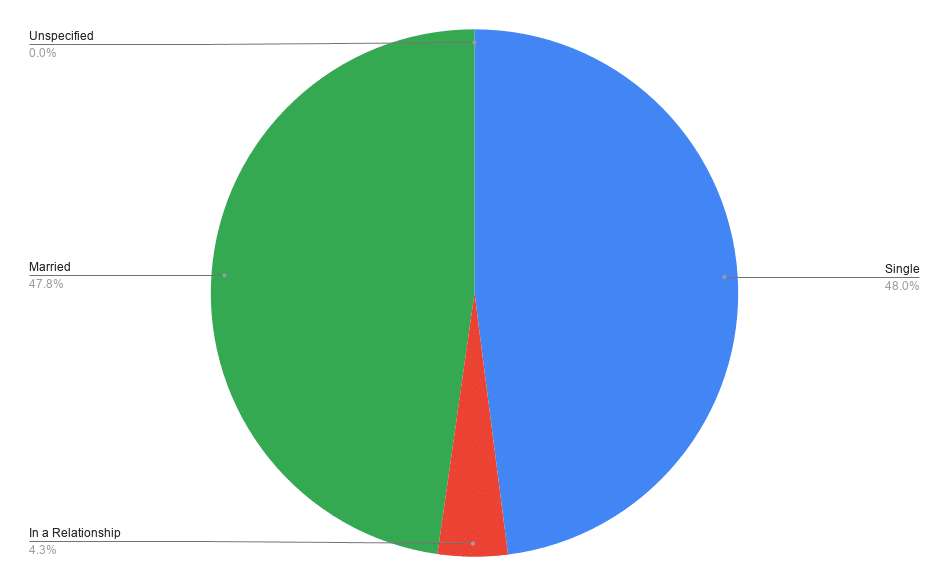
This status saw some bizarre returns, the same thing is happening with our monthly “comic fan” reporting and this is the third month this has happened. Both “engaged” and “unspecified” dropped to less than 1,000.
More Stats!
Spanish Speakers: 96.3 million individuals are Spanish speakers, 15.9%, which is below the 19.97% in the United States.
Education: 118.15 million have at least a college degree, that’s 19.51%.
Parents: 107.4 million, 17.73%, are parents! That’s a bit higher than the 16.48% in the United States.
And finally, what’s the crossover with fans of board games and video games?
Comic Book fans: 347.45 million (57.37%)
Video Game fans: 352.5 million (58.21%)
Comic Book and Video Game fans: 210.7 million (34.79%)
Comic Book or Video Game fans: 499.15 million (82.42%)
Discover more from Graphic Policy
Subscribe to get the latest posts sent to your email.
Source: Graphic Policy