

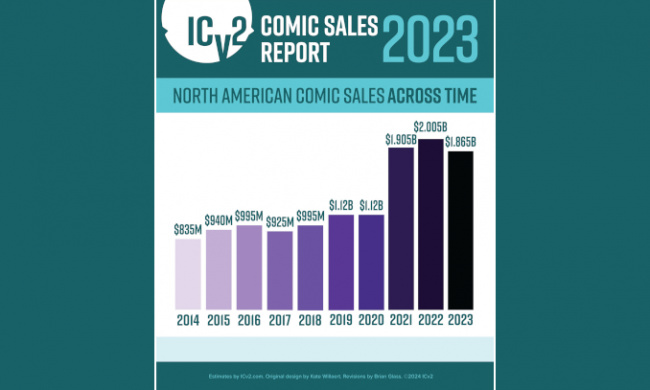
An ICv2 Release. Comics and graphic novel sales were down around 7% in 2023, according to a new estimate from ICv2. Total comics and graphic novel sales to consumers in the U.S. and Canada were around $1.87 billion in 2023, down 7% from $2.01 billion in 2022 (see “Covid Surge Crested in 2022“). And for those who are thinking that the comics business is in trouble, take a look at the comparison to 2019, before the pandemic, when sales were $1.1 billion; the 2023 sales represent a 70% increase over 2019’s.
“A single-digit percentage decline in the North American comics and graphic novel market in 2023 is a huge win,” ICv2 President Milton Griepp said of the report. “The many readers that found or re-found comics and graphic novels as a preferred form of entertainment during Covid are sticking around, maintaining a huge increase in market size over the last five years, despite the full return to normal daily activities post-pandemic and intense competition for consumers’ money and attention. That’s a testament to the power of the medium and to how hard everyone in the industry has worked to build and maintain this audience.”
Sales by Format and Channel
Trends in sales by format and channel did not vary much in 2023. By format, graphic novels were down 7% and periodicals down 6%, preserving their relative shares.
By channel, comic stores and the book channel, which includes online retailers like Amazon, declined by similar amounts: 8% for comic stores (see “Comics and Graphic Novel Sales in Comic Stores Down 8% in 2023“), and 7% for the book channel.
Comics on Kickstarter had a big year, up over 30% in dollars raised from backers in North America, with the Good Omens graphic novel by Colleen Doran, which raised £2.4 million worldwide, the biggest project.
For more in-depth analysis of the year-over-year trends, see “In Depth: Comics and Graphic Novel Sales Down 7% in 2023.”
Methodology
We’ve made a number of changes to methodology over the years, as distribution has fragmented and information on direct market sales has become more difficult to obtain. For comic stores, the analysis now uses data based on sales tracked at point-of-sale by the ComicHub system at over 125 stores. During the early stages of our use of that information, we used that data to build a model of sales for the entire comic store channel using comparisons developed during periods in which ComicHub and Diamond reporting overlapped. Since that time, we’ve used percentage changes in ComicHub sales, adjusted for changes in the number of stores reporting, to estimate trends for the overall market.
This methodology has risks; if, for example, sales in the ComicHub stores are not changing at the same rate as sales in the overall market, our estimates will be off. As this is a small, non-random sample of over 3,000 stores selling American comics worldwide, their sales trends may not be typical of all stores but do represent a variety of locations and store emphases. And it’s the largest aggregation of comic store data available at this time, so it’s all we’ve got to go on. We believe trends in the ComicHub stores are generally reflective of overall trends.
For the book channel, we obtain data from Circana BookScan, which allows us to see the total graphic novel sales in stores tracked by the service. Circana collects weekly point-of-sale data on print books from over 16,000 locations including e-tailers, chains, mass merchandisers, independent bookstores, and more. Circana covers approximately 85% of the U.S. trade print book market. Some publishers classify titles that are primarily text, or art books, as graphic novels; we’ve removed those titles from the ranking above. BookScan began incorporating ComicHub data into its reports in 2020, so we accounted for the ComicHub portion when estimating the size of the book channel. We estimate sales in stores not tracked by BookScan (i.e., indy bookstores, Canada) and include those estimates in our totals.
As presented above and in the accompanying infographics, the analysis was divided up between periodical comics (what some call “floppies” or “pamphlets”) and graphic novels. All print figures are calculated based on the full retail price of books sold into the market, and do not account for discounting or markup.
A Word on Digital
The biggest change in methodology for 2023 was that we have stopped reporting on download-to-own sales of digital comics. We did not report an estimate for digital sales for 2023, and have removed those estimates from the totals of the previous years to provide comparability.
There are two reasons for making that change. The most important is that subscriptions for online access to comics are comprising an increasing part in digital sales, and that’s a part of the market that’s opaque to the public, and to us. It would be like reporting CD sales as music streaming took over the market; download-to-own is just no longer the only or best statistic. As just one indication of the growth of subscription revenues for digital comics, in the prospectus for Webtoon’s IPO, the company revealed that it has 500,000 paying monthly customers in North America. Second, it’s become increasingly difficult for us to get reliable information as the DTO portion of the market has fragmented as comiXology was absorbed into Amazon proper.
For reference, the number we estimated for 2022 was $155 million in digital download sales.
Click Gallery below for Charts and Graphs!
Source: ICv2


